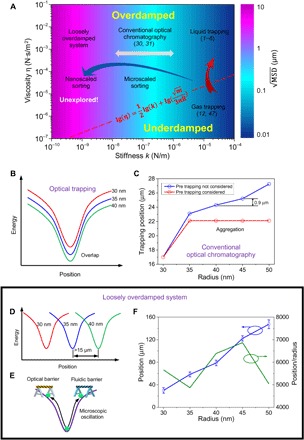
Fig. 1. Damping diagram unfolds the complete map of trapping and sorting particles in optofluidic systems: Classic trapping, microscale sorting, and nanoscale sorting.

(A) Oscillation diagram with stiffness of optical tweezers (k) and viscosity of the medium (η). Functions of optical manipulation from left to right are loosely overdamped system for nanoscale sorting (k ~ 10−10 to 10−8 N/m), optical chromatography for microscale sorting (k ~ 10−8 to 10−6 N/m), and optical trapping (k ~ 10−6 to 10−4 N/m). The optical trapping can be divided into liquid and gas trapping based on different viscosities. Parameters of m and R in the equation (the dividing line of underdamped and overdamped systems) are the mass and radius of particle, respectively. (B to F) Illustration of optical sorting of gold nanoparticles with radii of 30, 35, and 40 nm using technologies in the diagram. (B) Optical trapping is shown to be unable to sort nanoparticles because of the overlap of potential wells of different nanoparticles. (C) Calculation of trapping positions of 30- to 50-nm gold nanoparticles in the optical chromatography. Individual gold nanoparticles with different radii can be trapped in different positions using the Gaussian beam with a numerical aperture (NA) of 0.12. However, the theoretical minimum separation distance between them is only 0.9 μm. When the gold nanoparticles are trapped in the beam, the smaller nanoparticle absorbs light and greatly influences the trapping positions of larger gold nanoparticles. Therefore, 35-, 40-, 45-, and 50-nm gold nanoparticles will eventually aggregate. Detailed proof has been provided in the Supplementary Materials. (D) A loosely overdamped system is an ideal platform for nanoparticle sorting, in which 30-, 35-, and 40-nm gold nanoparticles can be separated with a large distance (>15 μm) away from each other. (E) Nanoparticles oscillate in microscale without escaping the system with stiffness of 10−10 to 10−8 N/m under the control of synchronized optical and fluidic barriers. (F) The experimentally observed sorting distance increases linearly with the radius, implying that each nanoparticle has a specific trapping position in the system. The separation sensitivity (position/radius) is shown on the right y axis.
