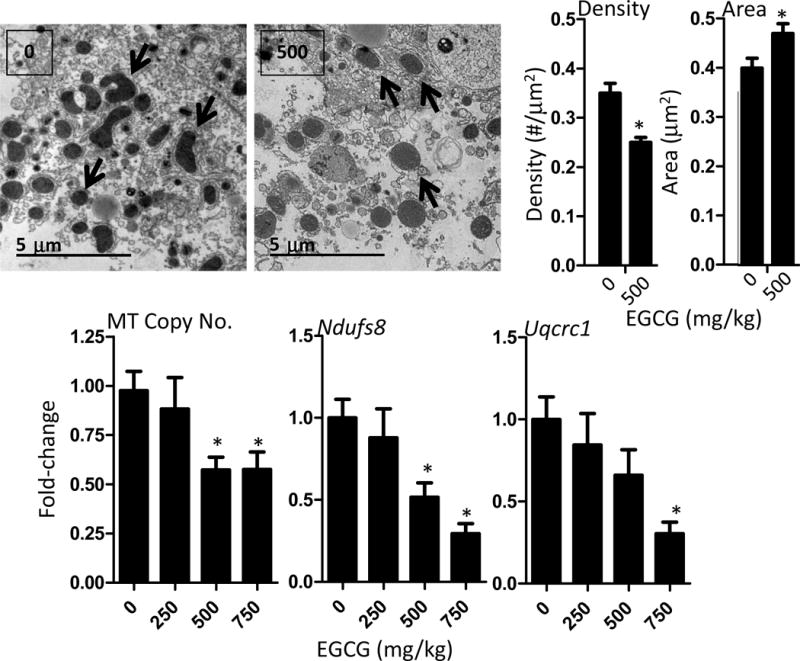
Figure 4.

Impact of oral bolus EGCG on hepatic markers of mitochondrial copy number and mitochondrial function in C57BL/6J mice. Transmission electron microscopy was used to determine mitochondria size (as area) and density (number of mitochondria per field) in mice treated with 500 mg/kg, ig EGCG or vehicle. Image J software was used to determine mitochondrial area and the number of mitochondria per field were determined. Representative electron micrographs are shown and black arrows indicate mitochondria. Real-time PCR analysis of the ratio of MT-Co2 (mitochondrial) to Rps18 (genomic) was used as a surrogate of mitochondrial copy number. Data represent mean ± SEM of n = 8–12. The expression of Ndufs8 and Uqcrc1 were determined by qRTPCR and used markers of respiratory complex I and complex III expression, respectively. Data represent mean ± SEM of n = 8–12. Data were analyzed by one-way ANOVA with Dunnett’s post-test. An asterisk indicates p < 0.05 compared to control mice.
