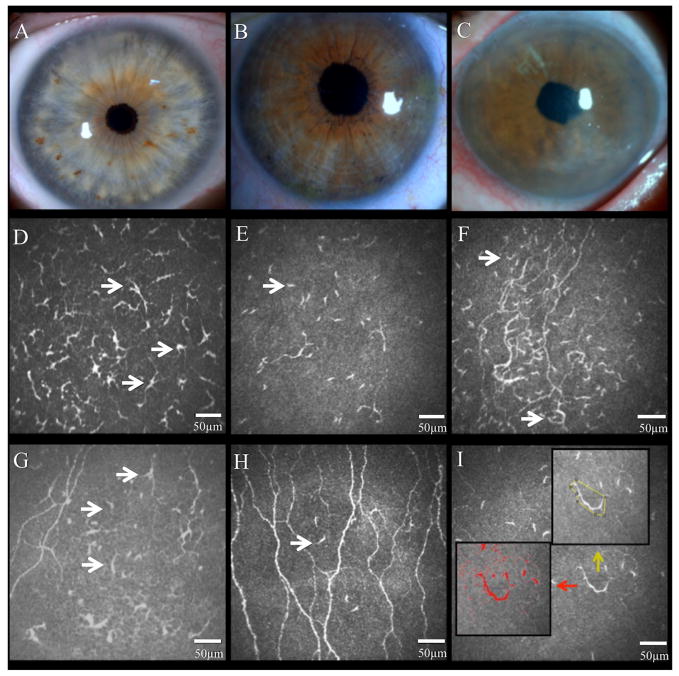
Figure 1.
Slit-lamp images of control eye (A), clinically unaffected contralateral eye (B), and affected eye with herpes zoster ophthalmicus (HZO) (C). Representative laser in vivo confocal microscopy images of corneal dendritiform immune cells (DCs) in the affected eye (D and E) and contralateral eyes of HZO patient (F and G), and normal control eye (H). Note the increase of DC density in both eyes of HZO patients. DC morphology analysis (I; in red DC size; yellow number of dendrites and DC field). Black arrows highlight DCs.

