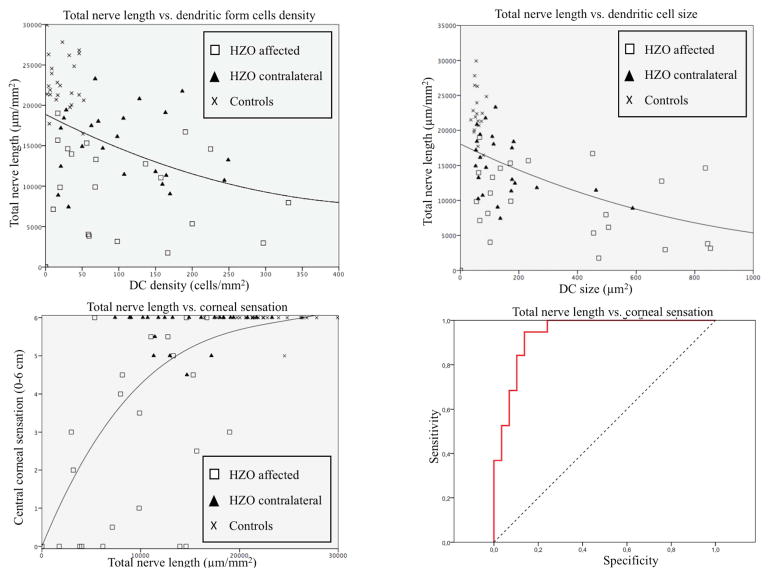
Figure 6.
Correlation for in vivo confocal microscopy parameters and corneal sensation. Total nerve length vs dendritic form cells density (A) and dendritic-form cells size (B) reveals positive correlation (R=−0.43 and R=−0.57, respectively). Total nerve length shows good positive correlation with corneal sensation (C)(R=0.63). ROC curve model demonstrates good specificity and sensitivity for detection of corneal sensation diminishment.

