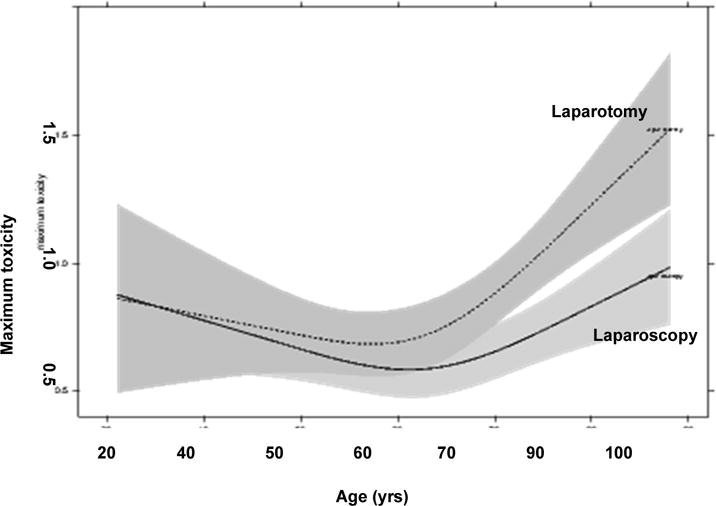
Figure 1.

Relationship between age and maximum toxicity for each treatment group. This is a linear model with outcome maximum toxicity. The model shows a treatment × age interaction with a moderate effect (P = 0.035). The effects plot suggests that the LAP group is prone to higher maximum toxicity after about age 60.
