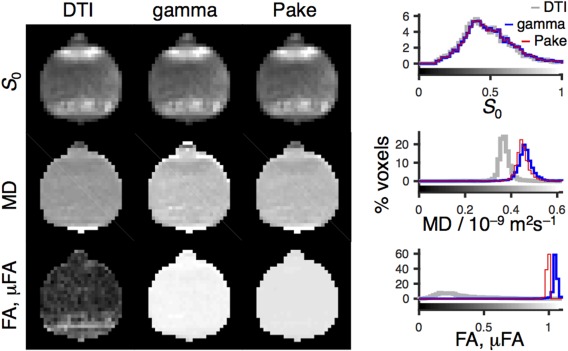
Figure 4.

MRI data acquired with the Connectome scanner using the liquid crystal phantom in Figure 1 and the pulse sequence in Figure 2. The data were analyzed with the DTI (column 1), gamma (column 2), and Pake (column 3) models (see Eqs. [10], [14], and [16]), yielding parameter maps of the initial signal intensity S 0 (row 1), the mean diffusivity MD (row 2), as well as the fractional anisotropy FA from DTI and the microscopic fractional anisotropy μFA from the gamma and Pake models (row 3). The 2D parameter maps show the axial slice through the center of the nearly spherical phantom (see Supporting Fig. S1 for all slices). The histograms (right) include data from all 4281 analyzed voxels throughout all slices of the 3D volume. The gray scales of the maps are given by the bars along the abscissas of the histograms. Note that although DTI largely fails to detect anisotropy, both gamma and Pake models yield μFA near the expected value of unity.
