
Figure 2.
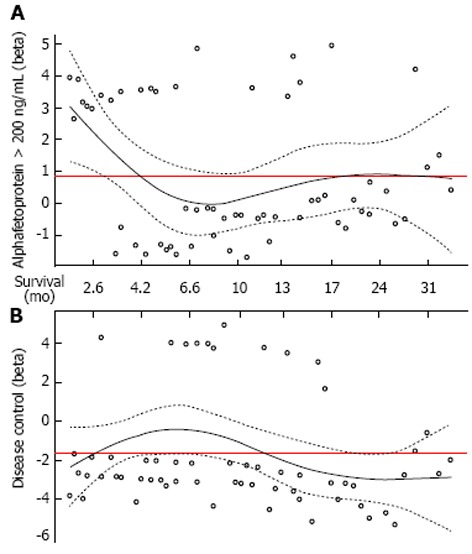
Plot of the scaled Schoenfeld residuals over time for alphafetoprotein serum level > 200 ng/mL (A) and disease control (B). The solid line shows the log of hazard ratio (beta) as a function of survival time with the 95%CI (dotted lines). The average beta value obtained at the Cox model without any time-adjustment is also reported (solid red line).