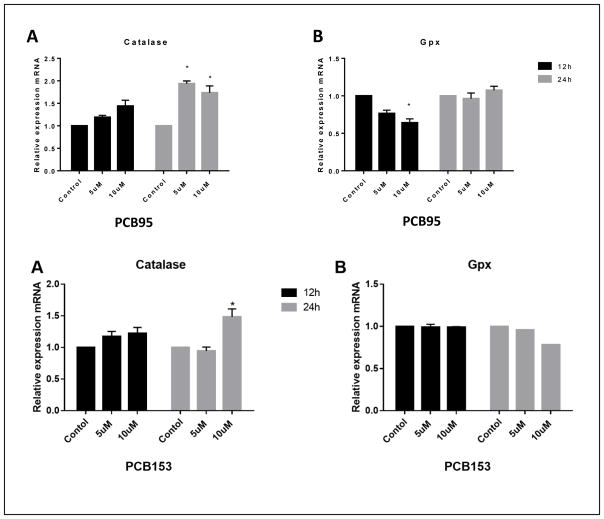
Figure 8.
Catalase and glutathione peroxidase gene expression in PC12 cells after exposure to PCB95 (top) or PCB153 (bottom). Both PCBs upregulated catalase, which was significant after 24h exposure while only PCB95 reduced GPx expression and only after 12h exposure. *p<0.05 compared to the control; data are from 2 to 4 experiments.

