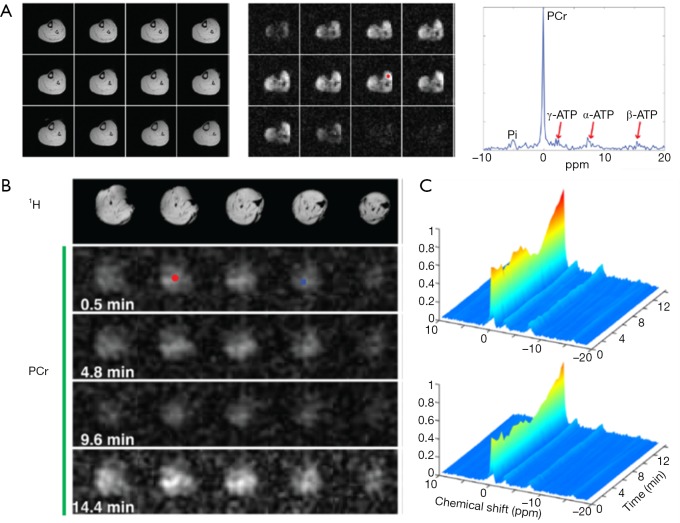
Figure 9.
31P-MRSI using SPICE. (A) 1H images (left), PCr maps (middle), and a 31P spectrum (right) obtained from human calf muscle at 3T. The location of the spectrum is indicated by the red circle in PCr maps. (B) Anatomic 1H images and dynamic PCr images of rat hindlimb during ischemia/reperfusion obtained at 9.4T. (C) Dynamic spectra from two different spatial locations corresponding to the red circle (upper) and blue square (bottom) in (B). Reproduced with the permission from Ma et al. (181).

