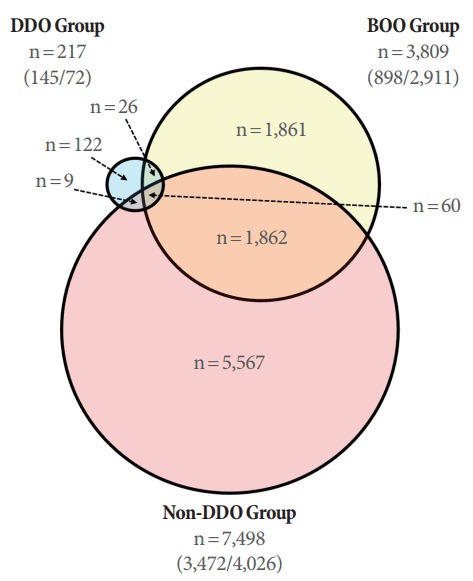
Fig. 3.

Venn diagram showing the number of genes that showed a greater than 2-fold change in expression in the bladder outlet obstruction (BOO) and deobstructed groups compared to the sham group. In the BOO group, 3,809 genes showed greater than 2-fold changes in gene expression compared to the sham group, while the group without detrusor overactivity (DO) after BOO/deobstruction (non-DDO) had significantly more such genes (n=7,498) and the group with DO after BOO/deobstruction (DDO) had significantly fewer such genes (n=217). The numbers in parentheses in each group represent (number of upregulated genes/number of downregulated genes).
