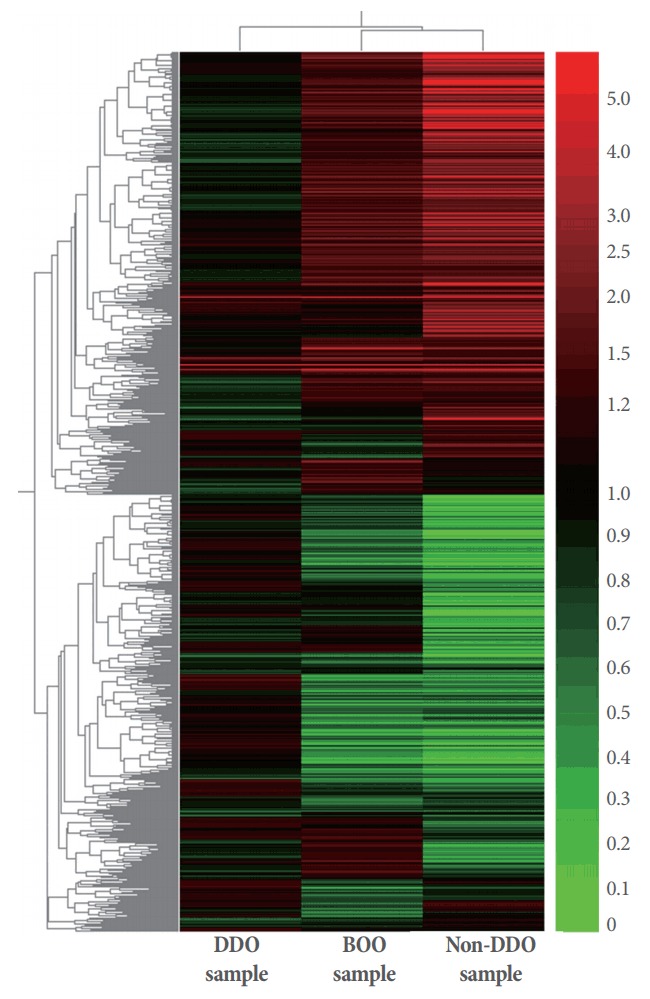
Fig. 4.

Hierarchical clustering of the total gene expression profiles analyzed on a microarray in samples from bladders from the partial bladder outlet obstruction (BOO) group and the groups with and without detrusor overactivity after BOO/deobstruction (DDO and non-DDO). Red color represents increased expression level and green color represents decreased expression levels.
