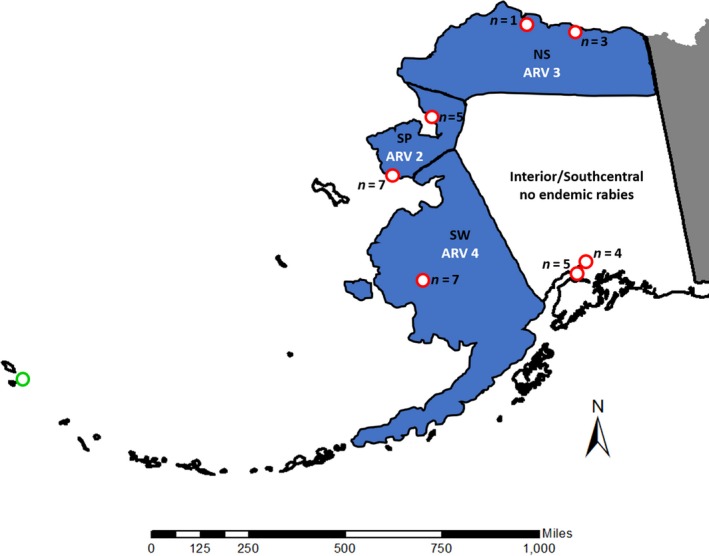
Figure 1.

Schematic of Alaska arctic fox and red fox samples analyzed using immunogenetic profiling. Approximate arctic rabies variant (ARV) distribution was modified from Goldsmith et al. (2016). Arctic rabies and arctic rabies‐free zones are indicated by blue and white background colors, respectively. Arctic fox and red fox sample locations are denoted by an open‐green circle or open‐red circles, respectively. Red fox sample size (n) for each location used in the genetic structure analyses is indicated. SW, Southwest; SP, Seward Peninsula; NS, North Slope
