Figure 4.

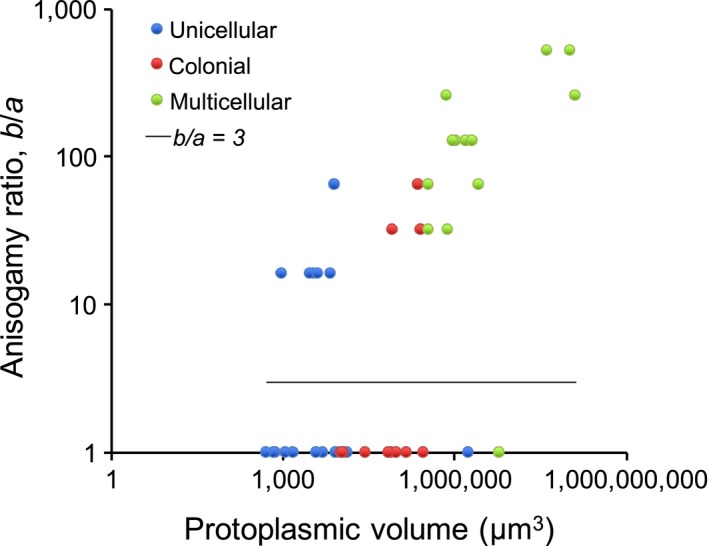
Anisogamy ratio plotted against the protoplasmic volume for volvocine algae. The horizontal line indicates the predicted “anisogamy threshold”

Anisogamy ratio plotted against the protoplasmic volume for volvocine algae. The horizontal line indicates the predicted “anisogamy threshold”