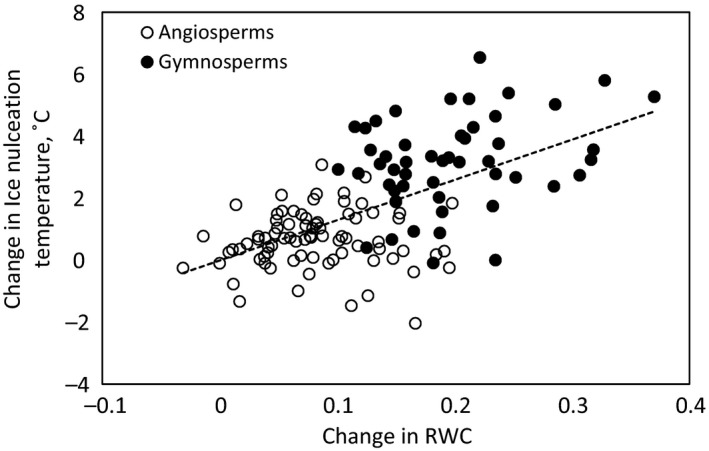
Figure 3.

Change in relative branch water content (RWC) plotted against change in ice nucleation temperature between saturated and fresh branches in winter. Linear fit is drawn with dashed lines for all species (y = 13.0x – 0.009; R 2 = .37; p < .0001)
