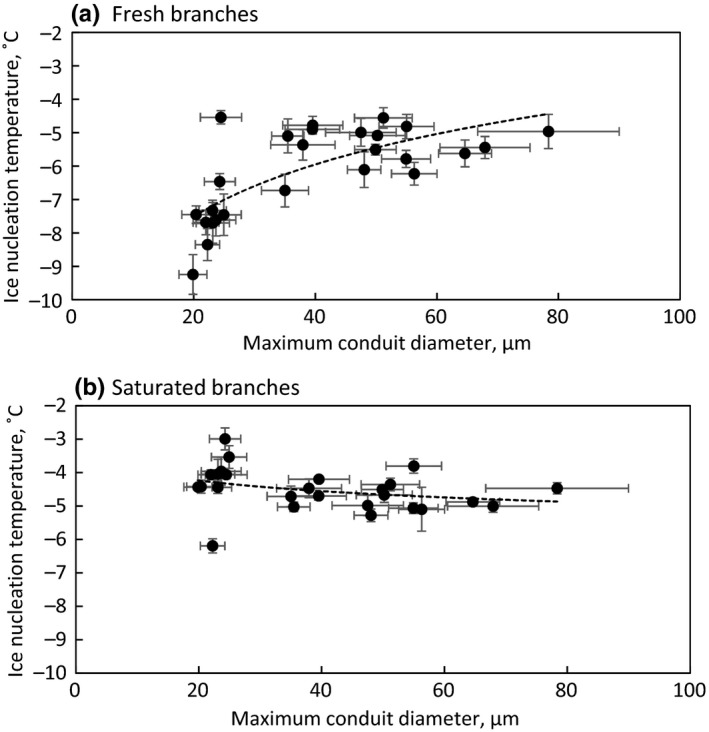
Figure 5.

Species‐specific average of apoplastic ice nucleation temperature plotted against average maximum conduit diameter in fresh (a) and saturated (b) branches collected in winter. Error bars show standard error, and sample size is 5 for ice nucleation temperature and 18 for conduit diameter per species. Logarithmic fit is drawn with dashed lines for a (y = 2.3ln(x) – 14.3; R 2 = .53; p = .0086) and in b (y = −0.5ln(x) – 2.8; R 2 = .10; p > .05)
