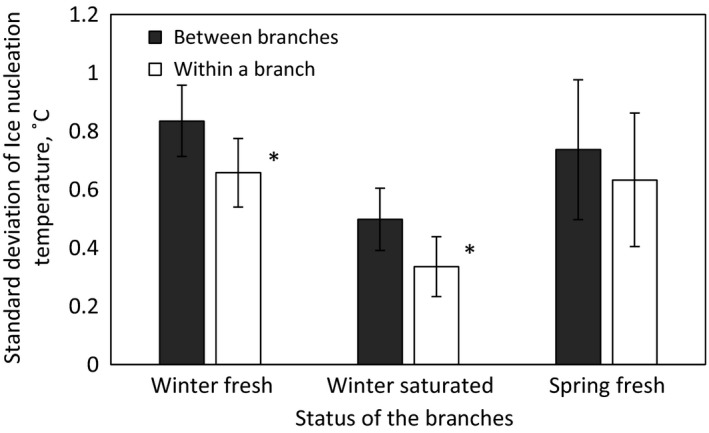
Figure 7.

Average standard deviation of species‐specific ice nucleation temperature between branches and between freeze–thaw cycles within a branch is presented in different status of the branches. Error bars show 95% confidence intervals, and stars indicate significant differences (**<.01; *<.05)
