
Figure 1.
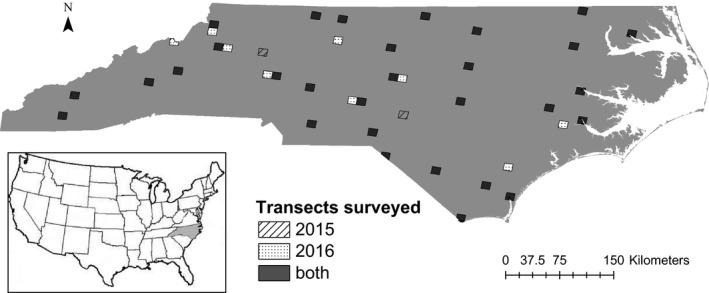
Study area map showing all North American Bat Monitoring Program (NABat) grid cells surveyed following a generalized random‐tessellation stratified master survey design in 2015 (strip), 2016 (dot), and both (solid) in the state of North Carolina, USA