
Figure 3.
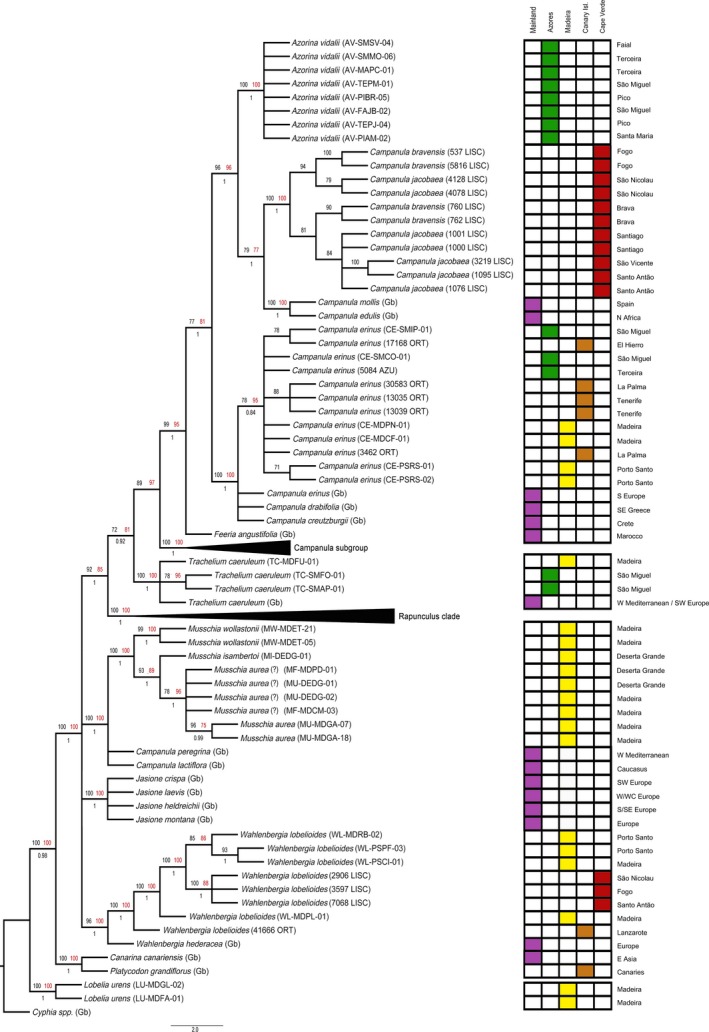
Plastid phylogeny. Best tree from maximum‐likelihood analysis of combined plastid dataset: matK, rbcL, psbA‐trnH, trnL‐F, petD, and atpB. Numbers above branches (≥70%) are maximum‐likelihood (black) and maximum‐parsimony bootstrap values (red). Number bellow branches (≥0.70) are Bayesian posterior probabilities. Sequences of taxa labeled with “(Gb)” were obtained on GenBank (Table S2)