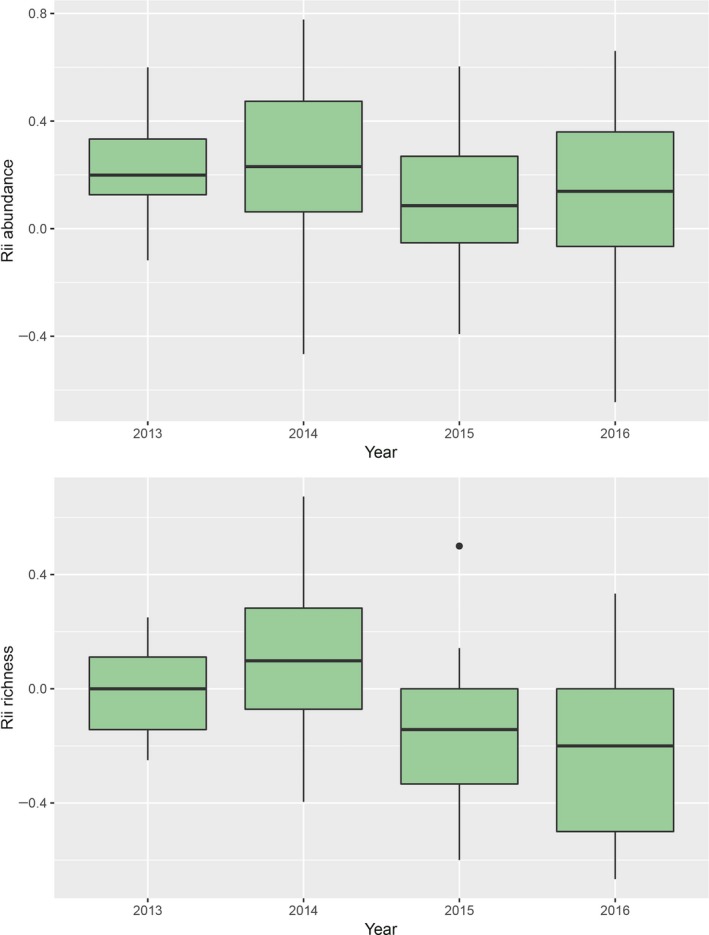
Figure 1.

The relative association patterns of annual plants within a desert ecosystem, Panoche Hills Ecological Reserve, between paired shrub and open vegetation surveys. The shrub species tested was Ephedra californica, and plots were 0.5 m in size and square and placed under shrubs and at paired, adjacent open sites within a canopy at distances of up to 1.5 m from a shrub. The relative interaction intensity effect size measure (Rii) is reported with positive values denoting positive associations or facilitation and negative values denoting negative associations (bounded from −1 to +1). The solid middle line in boxplots shows the median of data, whiskers show 1.5 standard deviations, and dots show outliers >1.5 quantile. Abundance is total number of individual annual plants within plots, and richness is the cumulative mean total of unique plant species
