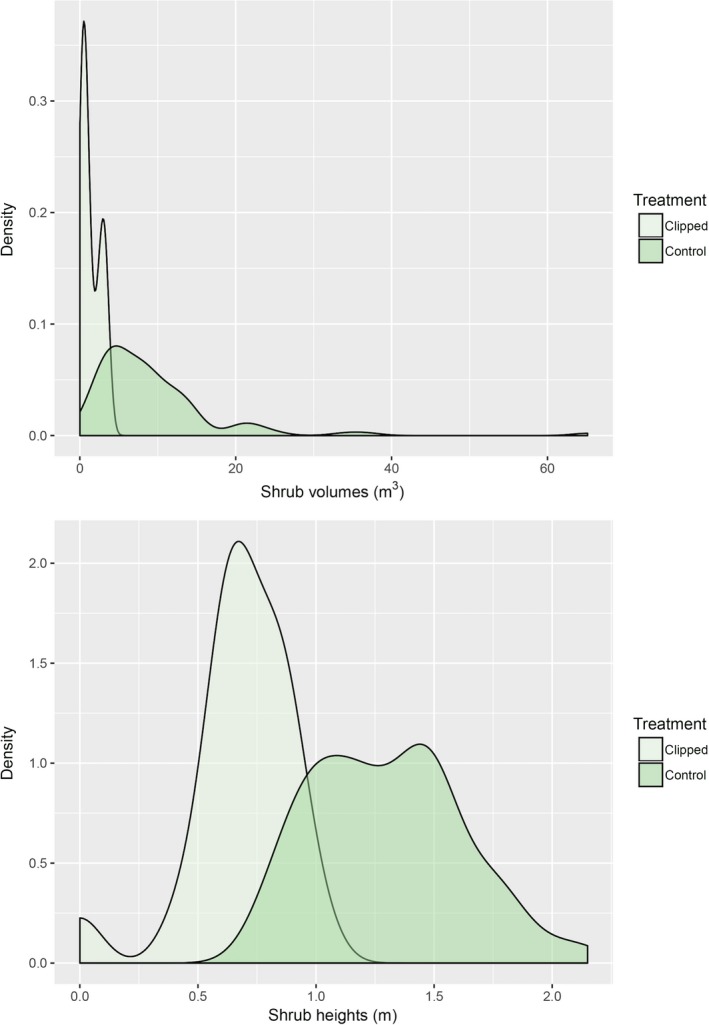
Figure 3.

Smoothed density estimate plots for clipped and control Ephedra californica shrubs in 2016 after 2 years of regrowth. Volume refers to canopy volume estimated using height and width measures (see text for calculations), and height is to the highest vertical living stem of a given shrub. The density estimates show the probability of those measures over the specific intervals listed on the x‐axis fit to a Gaussian kernel distribution (see statistical methods for detailed description in text)
