
Figure 1.
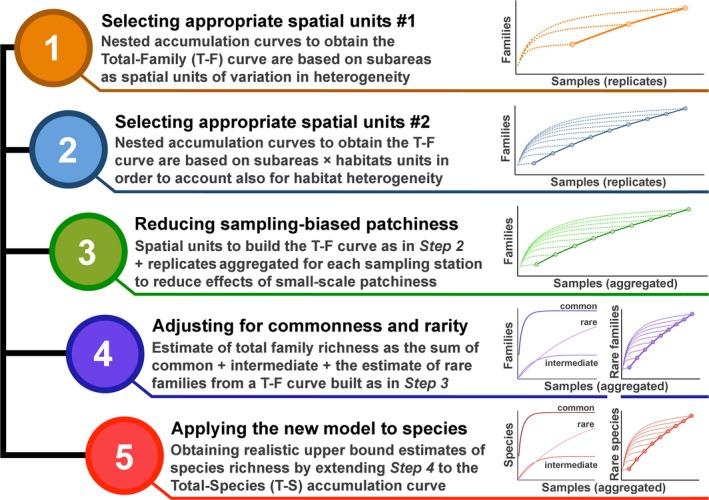
Logical sequence of the stepwise procedure described in the Methods section, which progressively integrate the T–F curve to account for spatial heterogeneity among subareas, among habitats within subareas, small‐scale patchiness, and rarity (Steps 1–4). The last step (5) refers to the application of the fully improved model to species richness estimates