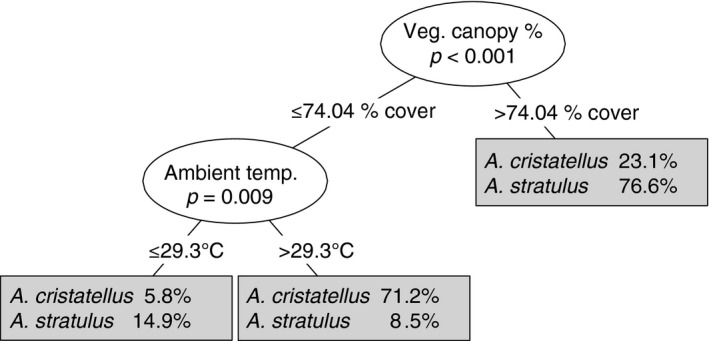
Figure 5.

Classification tree for habitat use differences in A. cristatellus and A. stratulus. Species percentages indicate the percentage of all sampled individuals of each species in each group (high canopy cover, low canopy cover and high temperature, low canopy cover and low temperature)
