Figure 7.

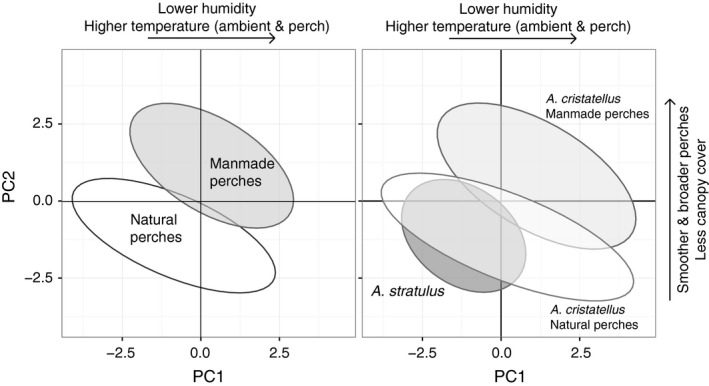
Principal components 1 and 2 plotted with 95% confidence interval ellipses grouped by perch type for available habitat (left) and utilized habitat (right)

Principal components 1 and 2 plotted with 95% confidence interval ellipses grouped by perch type for available habitat (left) and utilized habitat (right)