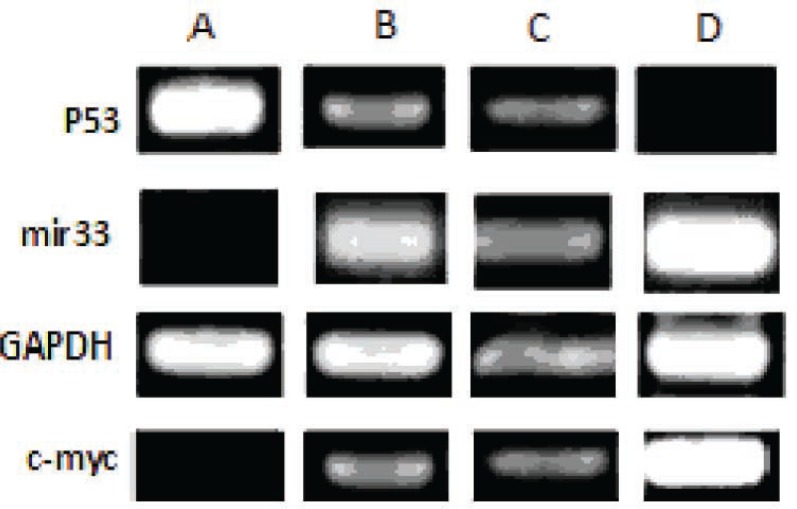
Figure 6.
Results of RT-PCR. (A) CD34+ cells (the control group). In this group expression of p53 was higher and miR-33a expression was lower than those of other groups. (B) CD34+ cells that only cultured with cytokines, (C) CD34+ cells cultured indirectly on a feeder layer, (D) CD34+ cells directly cultured on an ADSCs feeder layer. In this group, expression of miR-33a was higher than that in other groups

