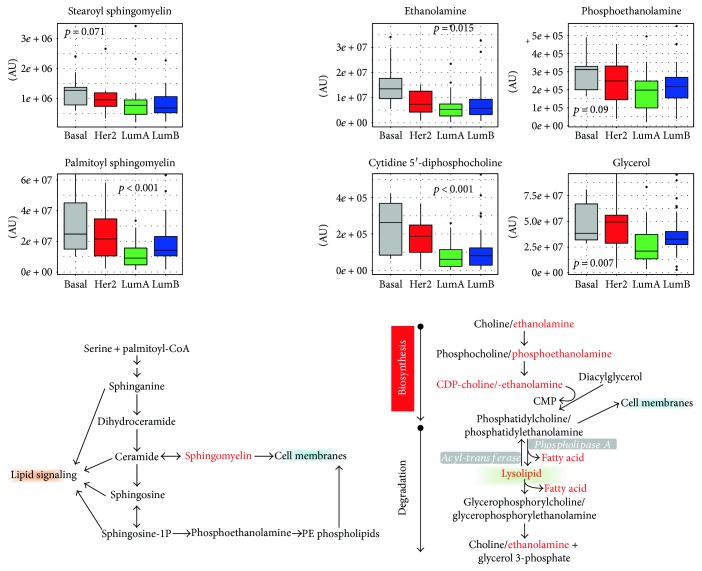
Figure 6.
Phospholipid and sphingolipid metabolism. Intermediates participating in the phospholipid and sphingolipid metabolisms are schematically reported. For metabolites indicated in red-color fonts, levels across breast cancer molecular subtypes are reported as box plots. p values refer to one-way ANOVA on raw data. AU = arbitrary units.

