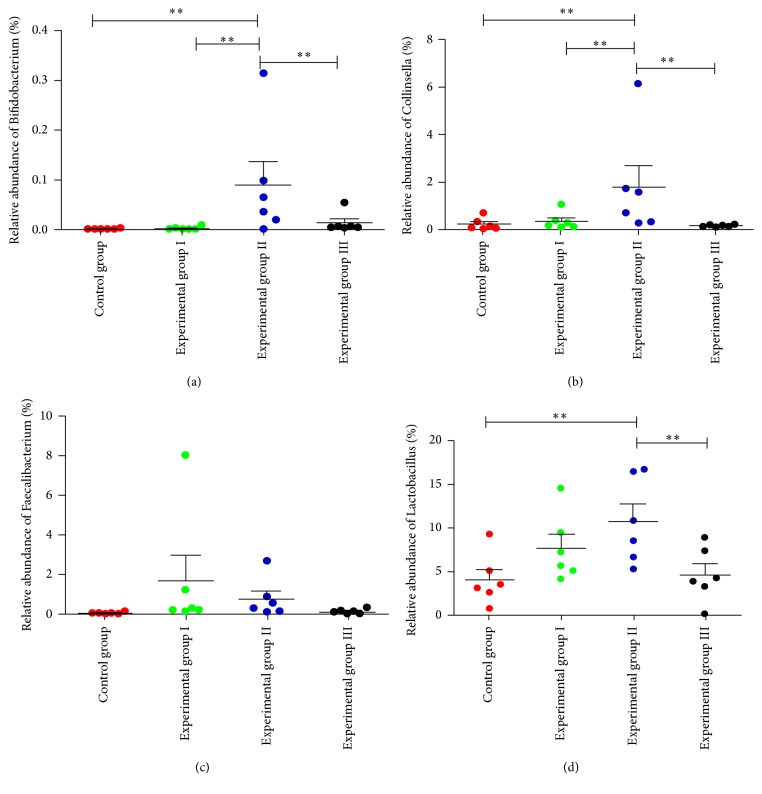
Figure 6.
Taxonomy-based analysis at the genus level in 32-day-old piglets. In each of the panels, the analysis result at the genus level was indicated by the label on the y-axis. ∗∗P < 0.05 means the difference was significant by the Multigroup comparisons (the LSD test) which were carried out by analysis of variance (ANOVA) with SPSS 20.0.

