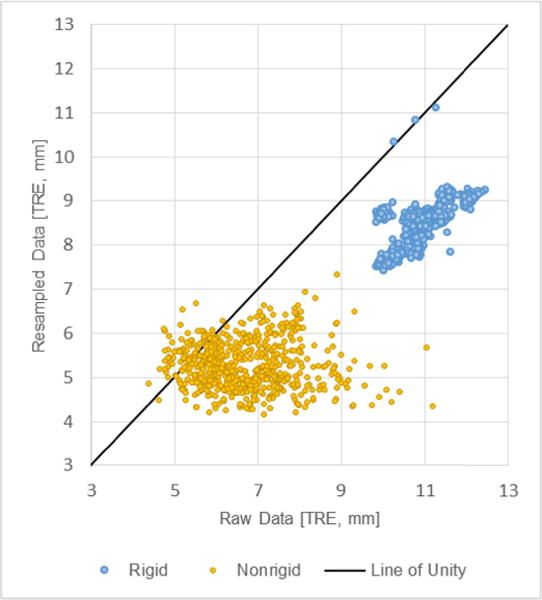
Fig. 8.

A scatterplot of average TRE over the 650 simulated cases. The x-axis represents average case TRE using a simulated raw surface data scenario while the y-axis represents that simulated surface data after undergoing resampling. Rigid and nonrigid registration results are presented in blue and gold respectively.
