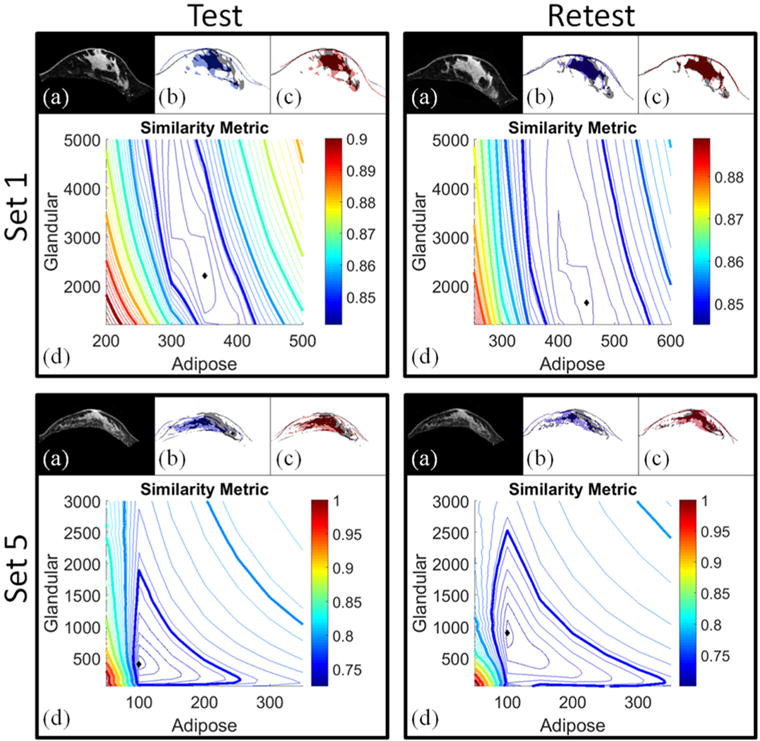
Figure 5.

Summary of the stiffness estimation results for Set 1 and Set 5. Image alignment comparisons are displayed in panels (a)–(c) for each test–retest set. In (a), axial anatomical image slices are shown for the baseline configurations. (b) Contains masked versions of the baseline configuration image (gray) and gravity-induced configuration image (blue). In (c), masked image slices of the model-deformed configuration with optimized stiffness values are shown in red overlaid with the baseline configuration (gray). Qualitatively, there is significant improvement in the baseline image alignment when model-optimized stiffness parameters are used. Similarity metric maps are shown in (d) where the diamond in each map represents the minimum value of the contour plot (i.e. the optimal stiffness parameters). Contours represent the error in image similarity for each adipose-glandular value sampled.
