
Figure 6.
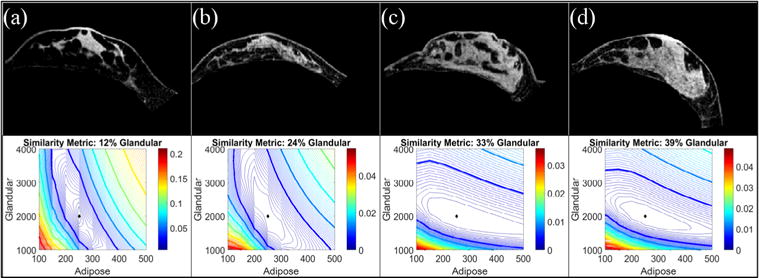
Simulation results investigating the effect of fibroglandular content on the form of the similarity metric. Baseline images are shown from subjects with fibroglandular tissue volume contents of (a) 12%, (b) 24%, (c) 33%, (d) 39%. Using a 30° change in the gravitational unit vector and Young’s modulus values of 0.25 kPa (adipose) and 2 kPa (fibroglandular), simulated gravity-deformed images were created for each baseline image shown in the top panel. The bottom panel shows the resulting similarity error contour maps. The diamond represents the error map minimum.