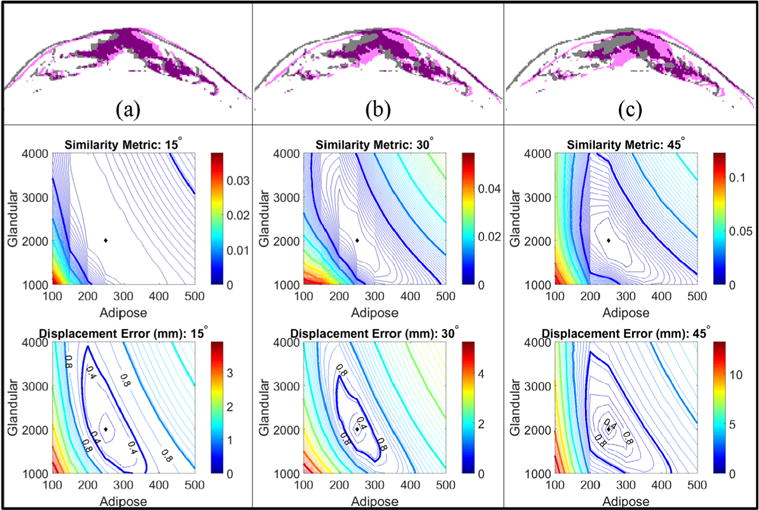
Figure 7.

Simulation results investigating the effect of deformation magnitude on the form of the error metrics. 15 (a), 30 (b), and 45 (c) degree changes in gravitational loading conditions with Young’s modulus values of 0.25 kPa (adipose) and 2 kPa (fibroglandular) were used to simulate gravity-deformed images with increasing (from left to right) deformation magnitudes. Contour plots of the image-based similarity metric are shown above the nodal displacement error contour maps for each rotation level. The displacement error maps are marked to indicate the contour levels that approximate the full (0.8 mm) and half (0.4) in-plane voxel sizes. The diamonds indicate the minimum value in each contour plot.
