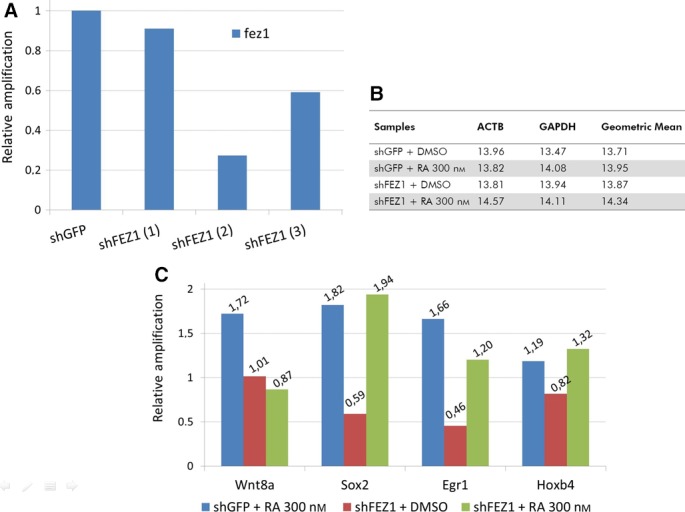
Figure 5.

Depletion of FEZ1 and gene expression analysis. (A) Three shFEZ1 (plus shGFP as a control) were tested and shFEZ1(2) was selected to subsequent studies (~ 80% silenced). (B) From a panel of five control genes, beta actin (ACTB) and gapdh were automatically selected for relative quantification, and the results were analyzed by the ΔΔCt method. Group ‘shGFP + DMSO’ was selected to normalize the samples. (C) Genes are the same from Fig. 4C. The low values, below or close to 1.0, mean that there was no gene activation, confirming the results obtained with the overexpression situation.
