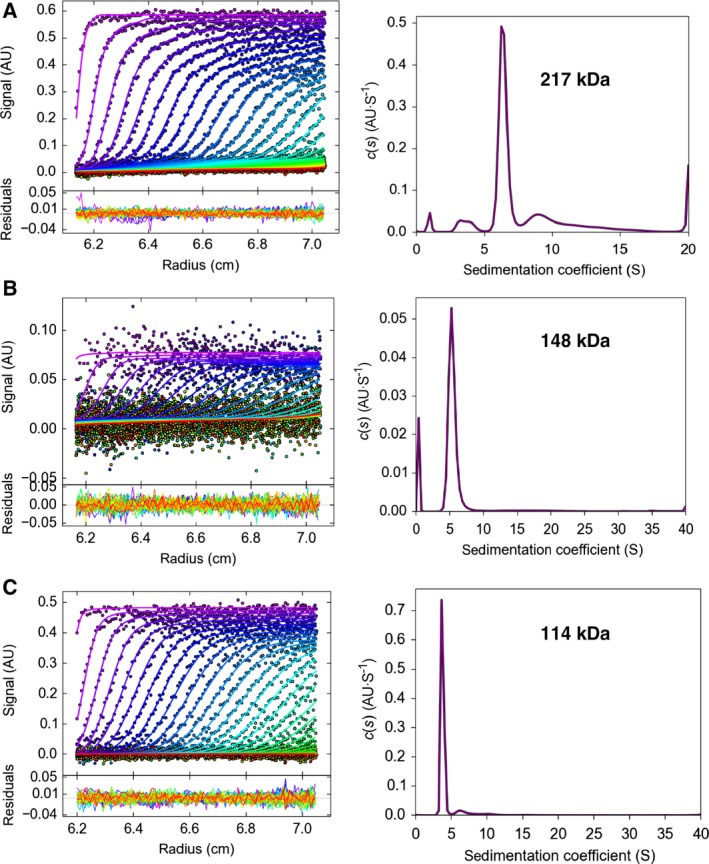
Figure 2.

Dimer formation of Atg11 (A), Atg11_N (B), and Atg11_C (C), as revealed by analytical ultracentrifugation. The upper panels show the distribution of sedimentation coefficient, c(s), while the lower panels show the development of the moving boundaries superimposed on those calculated from the c(s) values.
