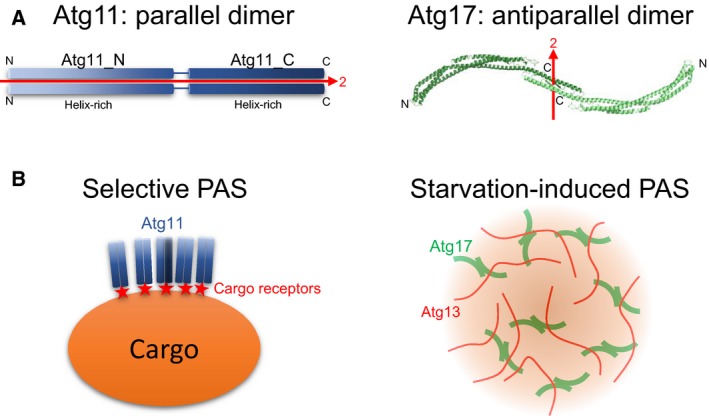
Figure 4.

Proposed Atg11 architecture and model of selective PAS organization. (A) Left, schematic drawing of the Atg11 dimer. Right, crystal structure of the Atg17 dimer (PDB ID 5JHF). N and C indicate the N and C termini of each protomer, respectively. The pseudo‐two fold symmetrical axis is shown with a red arrow. (B) Proposed model of selective PAS (left) and starvation‐induced PAS (right). For simplicity, other factors involved in PAS have been omitted.
