Figure 3.

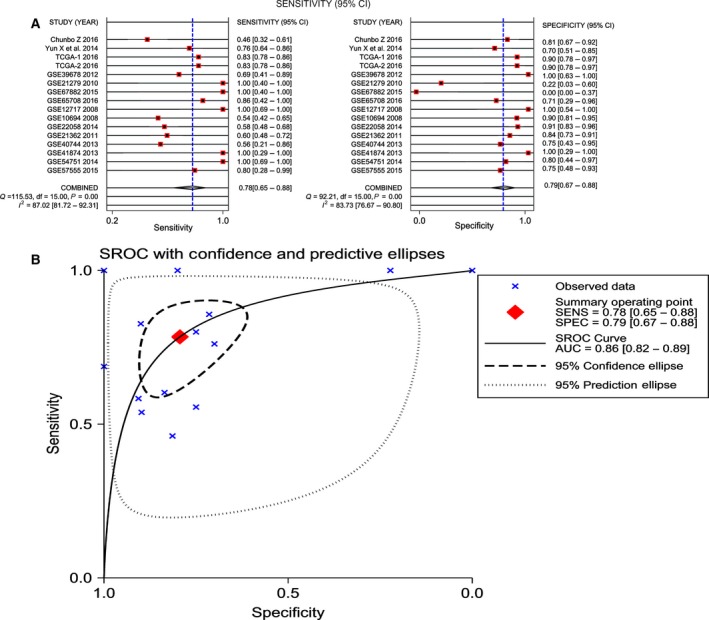
Diagnostic accuracy of miR‐101‐3p in HCC. (A) Sensitivity (SENS) and specificity (SPEC) with corresponding heterogeneity statistics. (B) SROC curves for miR‐101‐3p with CI in the diagnosis of HCC.

Diagnostic accuracy of miR‐101‐3p in HCC. (A) Sensitivity (SENS) and specificity (SPEC) with corresponding heterogeneity statistics. (B) SROC curves for miR‐101‐3p with CI in the diagnosis of HCC.