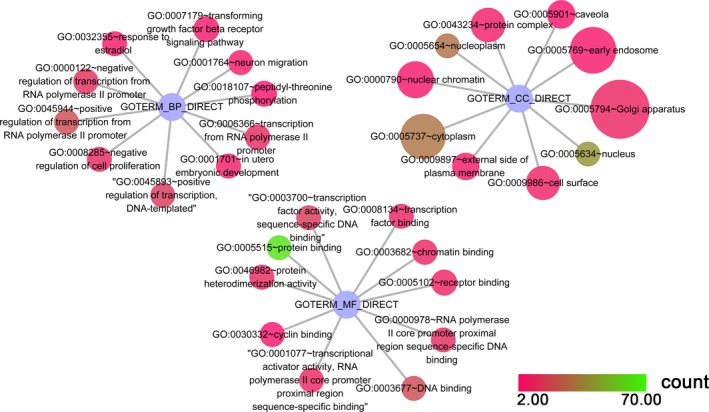
Figure 9.

The KEGG pathway analysis of miR‐101‐5p predicted target genes in HCC. Pathway analyses were performed to identify significantly enriched pathways by using cytoscape v. 3.4.0. The top 30 pathways are displayed; the map node size represents the P value of targets, low values are indicated by large nodes, and the node color represents the gene count number with low values indicated by pink.
