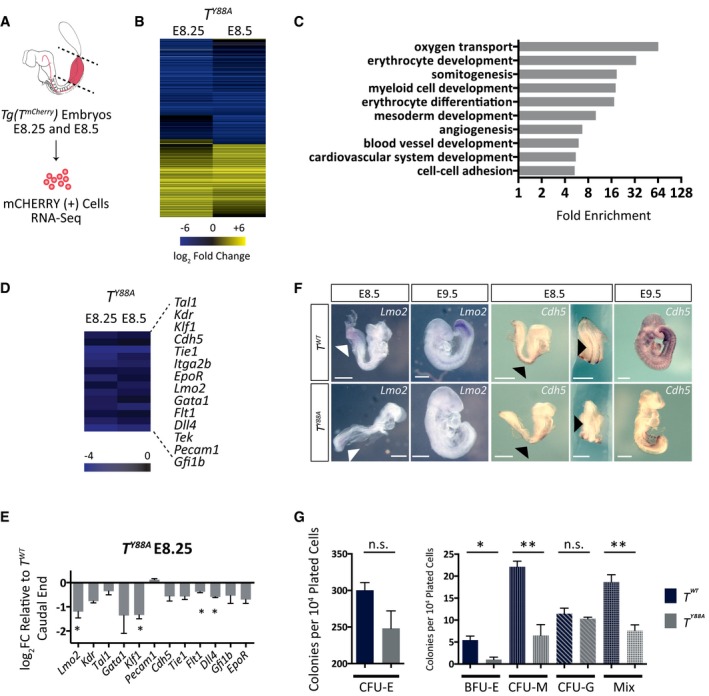
Schematic illustrating microdissection and FACS of T‐mCHERRY(+) mesodermal cells from caudal ends of Tg(T
mCherry) embryos for RNA‐Seq analysis. Dotted lines indicate microdissection planes before FACS.
Heat map illustrating dysregulated gene expression (log2 fold change ≥ 1.3 when compared to T
WT) in T
Y88A mutant mesodermal cells at E8.25 and E8.5.
Statistical overrepresentation test (PANTHER) of GO terms from dysregulated genes in T
Y88A mutant mesodermal cells at E8.25 and E8.5 (log2 fold change ≥ 1.3 when compared to T
WT). Gray bars indicate fold enrichment over the reference Mus musculus gene list.
Heat map displaying downregulation of multiple genes important for hematopoietic and endothelial cell development in T
Y88A mutants at E8.25 and E8.5 from the RNA‐Seq.
RT‐qPCR validation of gene expression in microdissected caudal ends of E8.25 T
Y88A mutants compared to T
WT control. n = 3 biological replicates of pools of five microdissected caudal ends. Error bars = SEM. *P ≤ 0.05 using a one‐sample t‐test.
WISH analysis of Lmo2 expression in T
Y88A compared to T
WT control embryos from E8.5 to E9.5. White arrowheads indicate Lmo2 expression in the caudal end of embryos. WISH analysis of Cdh5 expression in T
Y88A compared to T
WT control embryos from E8.5 to E9.5. Black arrowheads indicate expression of Cdh5 in the developing dorsal aorta. Scale bar: 500 μm.
CFC assay using cells derived from embryoid bodies of T
WT and T
Y88A mESCs. The graph represents the number of colonies per 104 plated cells. n = 3 biological replicates, with each replicate comprised of three technical replicates. Error bars = SEM. *P < 0.05, **P < 0.01 using the unpaired t‐test. n.s. not significant. CFU‐E, colony‐forming unit erythroid; BFU‐E, burst‐forming unit erythroid; CFU‐M, colony‐forming unit macrophage; CFU‐G, colony‐forming unit granulocyte; Mix, presence of two or more myeloid progenitor cell types (macrophage, granulocyte, or erythroid).

