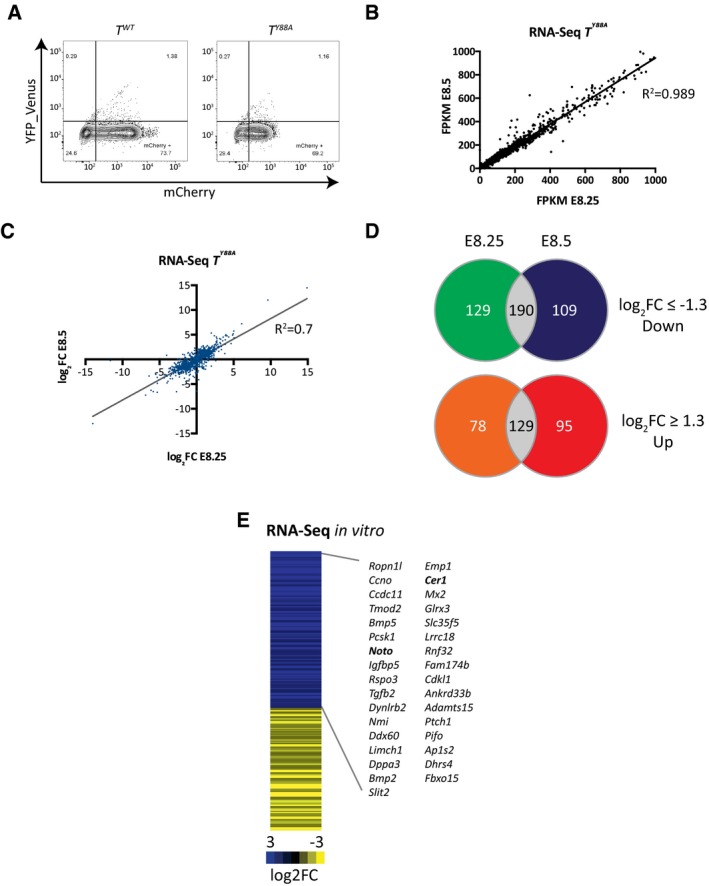
Figure EV3. Transcriptome analysis in TY 88A mutants in vivo .

- FACS plots from the sorting of T‐mCHERRY‐positive cells from T WT and T Y88A embryos for RNA‐seq.
- Scatter plot of FPKM values from RNA‐Seq using mesodermal cells of T Y88A embryos at E8.25 and E8.5 (one biological replicate for each timepoint).
- Scatter plot of log2 fold change values comparing T Y88A mutant mesodermal cells to T WT at E8.25 and E8.5 (log2 fold change ≥ 1.3).
- Venn diagrams illustrating genes that are dysregulated both at E8.25 and E8.5 in T Y88A mutant mesodermal cells compared to T WT (log2 fold change ≥ 1.3).
- Heat map depicting dysregulated gene expression (log2 fold change ≥ 1.3) in T Y88A mesodermal cells differentiated in vitro compared to T WT from RNA‐Seq of one biological replicate. Gene names correspond to genes that are downregulated and contain a nearby TBS with reduced H3K27ac (fold change > 1.4). Bold gene names indicate known T targets.
