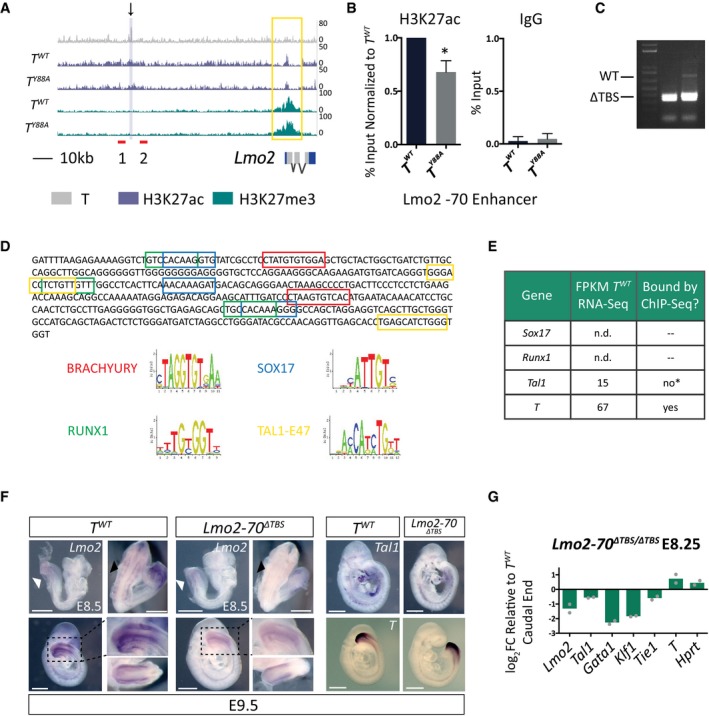
Figure 5. T regulates Lmo2 expression through binding to a distal enhancer.

- T binding and H3K27ac/me3 tracks from T WT and T Y88A mutant mesodermal cells differentiated in vitro at the Lmo2 locus. The black arrow indicates the T binding region that was removed using CRISPR/Cas9 nickase technology. Red lines indicate primers used to genotype the CRISPR/Cas9‐mediated deletion. The yellow box indicates altered H3K27ac at the TSS. The purple‐shaded box indicates the region amplified in the ChIP‐qPCR analysis.
- ChIP‐qPCR analysis of H3K27ac at the −70 enhancer of Lmo2. IgG ChIP was used as a negative control. Error bars depict SD of n = 3–4 biological replicates. *P = 0.009 using a one‐sample t‐test.
- Genotyping PCR from genomic DNA of Lmo2‐70 ΔTBS/ΔTBS mESC clones, using primers depicted in (A), revealed homozygous mutant deletion clones.
- Motif analysis of the 400‐bp deleted region within the −70 enhancer of Lmo2. Colored boxes represent motifs pictured below, as predicted by ConSite 60.
- Table illustrating the lack of Sox17 and Runx1 expression in RNA‐Seq of T WT embryos in vivo at E8.25. While Tal1 is expressed, previous reports have shown that it binds to the Lmo2 −75 enhancer in mesodermal cells, and not the Lmo2 −70 enhancer. *ChIP‐Seq tracks from 45 can be found in Fig EV5C. The only factor that is expressed and bound at the Lmo2‐70 enhancer by ChIP‐Seq is T.
- WISH analysis of Lmo2, Tal1, and T expression in control T WT compared to Lmo2‐70 ΔTBS/ΔTBS embryos from E8.5 to E9.5. Black dotted lines indicate the magnification of a lateral view of the caudal end of the embryo, shown in the inset. The second inset pictured below is a dorsocaudal view of the tail. White arrowheads indicate Lmo2 expression in the caudal end mesoderm. Black arrowheads indicate Lmo2 expression in the intersomitic vessels. Scale bar: 500 μm.
- RT‐qPCR analysis of gene expression in the caudal ends of E8.25 Lmo2‐70 ΔTBS/ΔTBS embryos compared to T WT control. The mean of n = 2 biological replicates of pools of five microdissected caudal ends is depicted.
