
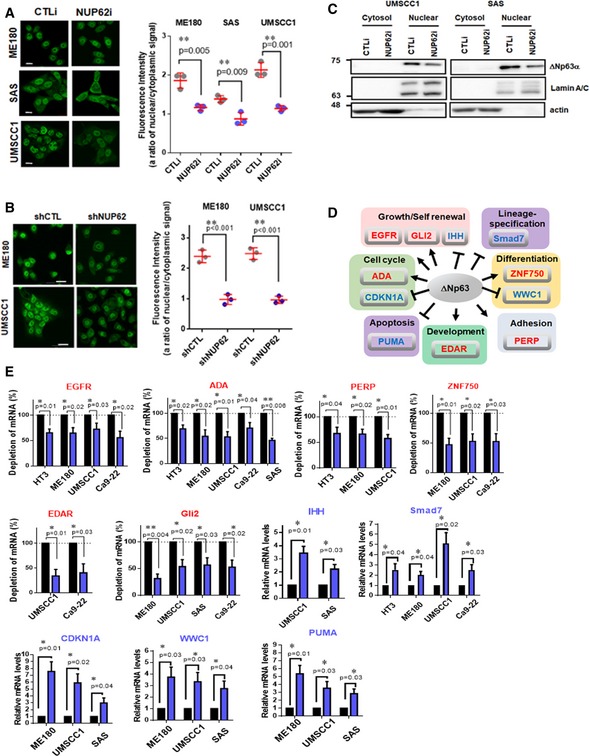
Figure 4. NUP62 regulates ΔNp63α nuclear transport in SCCs.
-
A, BImmunofluorescence confocal microscopic analysis of ΔNp63α in SCC cells after transient depletion of NUP62 by siRNA (72 h post transfection), (A) and shRNA (B). Representative pictures [bar: 10 μm (A) and 20 μm (B)] and the quantifications as ratio of nuclear/cytoplasm signals were presented as scatter plot with mean ± SD from three independent experiments (n = 3). P values are based on unpaired two‐tailed t‐test with *indicating P < 0.05 and **P < 0.01.
-
CWestern blot analysis of ΔNp63α protein levels in cytosol and nuclear fractions of SCC cells depleted NUP62.
-
DTranscriptional targets of ΔNp63α, grouped according to their known functions. Red; activated genes, Blue; suppressed genes.
-
EqRT–PCR analysis of ΔNp63α target genes mRNA in SCC cells depleted NUP62. Expression levels of cells treated with scrambled siRNAs is considered 100%. Data show mean ± SD from three independent experiments (n = 3). P values are based on one sample t‐test with *indicating P < 0.05 and **P < 0.01.
Source data are available online for this figure.