Figure 3.

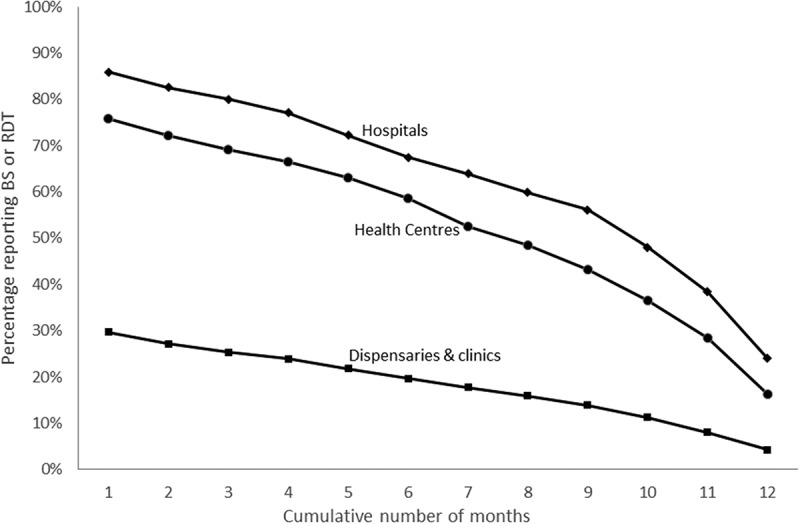
Number of facilities with data on BS or RDT done reported by month. Showing the scale of completeness of reporting by level of facility in DHIS2 by month between November 2015 and October 2016.

Number of facilities with data on BS or RDT done reported by month. Showing the scale of completeness of reporting by level of facility in DHIS2 by month between November 2015 and October 2016.