Figure 1.
Structural Features and Phosphorylation Pattern of SOG1 Mutants.
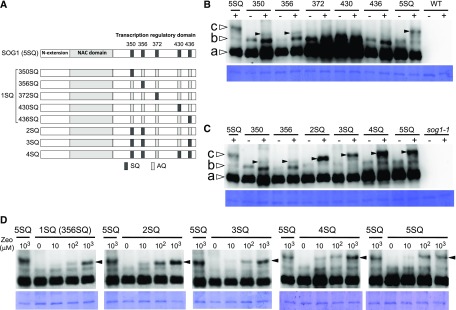
(A) Structural features of SOG1. The N-terminal extension, NAC domain, and transcription regulatory domain are shown. The five Ser-Gln (SQ) motifs are represented by dark-gray boxes, and the mutated (to Ala-Gln) AQ motifs are represented by light-gray boxes.
(B) and (C) Detection of phosphorylated forms of SOG1. sog1-1 lines harboring ProSOG1:SOG1[1SQs (350SQ, 356SQ, 372SQ, 430SQ, or 436SQ)]-Myc (B) and sog1-1 lines harboring ProSOG1:SOG1[2SQ, 3SQ, 4SQ, and 5SQ]-Myc (C) were used. Five-day-old seedlings grown on MS plates were transferred to liquid medium with (+) or without (−) 1 mM zeocin, and total protein was extracted 1 h later. Phosphorylated forms of SOG1 were detected using an SDS-PAGE gel containing Phos-tag. Coomassie blue staining is shown below. Nonphosphorylated, phosphorylated, and hyperphosphorylated SOG1-Myc (bands a, b, and c, respectively) observed in wild-type SOG1 are indicated by white arrowheads. Hyperphosphorylated SOG1-Myc observed in phosphorylated SOG1 mutants are indicated by black arrowheads. As negative controls, wild-type (B) or sog1-1 plants (C) with no SOG1-Myc were loaded on the right side of the gel.
(D) Effect of zeocin concentration on phosphorylation of SQ sites in SOG1. This experiment was conducted similarly to the ones shown in (B) and (C), using a variety of zeocin concentrations (0, 10, 100, and 1000 μM). Black arrowheads indicate hyperphosphorylated SOG1-Myc.

