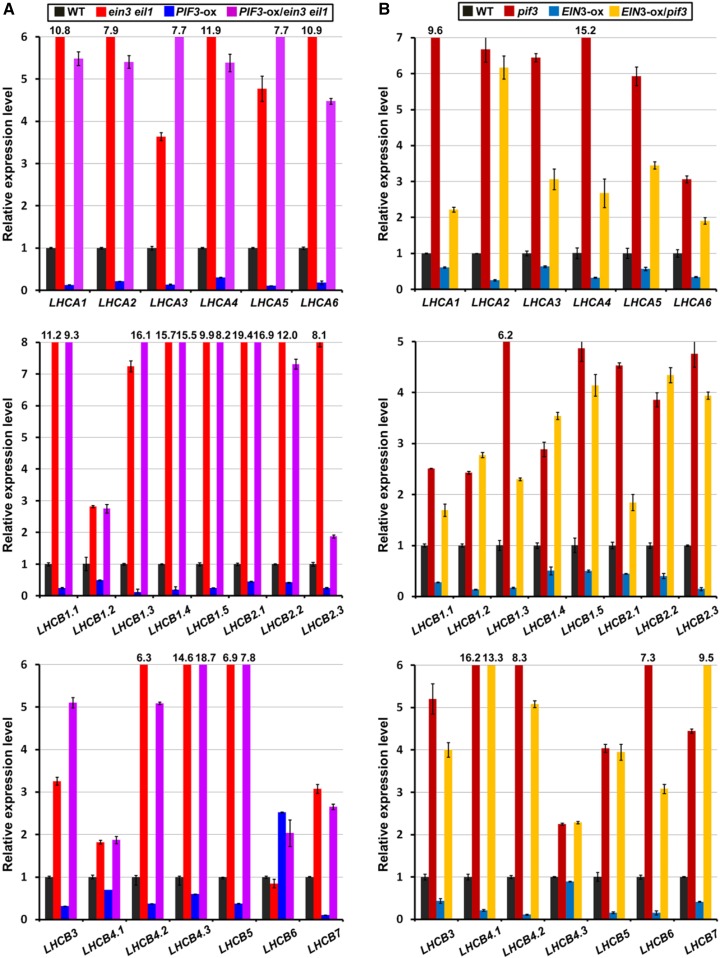
Figure 5.
EIN3 and PIF3 Depend on One Another to Repress LHC Gene Expression.
(A) RT-qPCR results show the relative expression levels of LHCA and LHCB genes in wild-type, ein3 eil1, PIF3-ox, and PIF3-ox/ein3 eil1 4-d-old etiolated seedlings. Each experiment was performed at least three times with similar results and the representative results were presented. Error bars represent average value ± sd (n = 3) from technical triplicates.
(B) RT-qPCR results show the relative expression levels of LHCA and LHCB genes in wild-type, pif3, EIN3-ox, and EIN3-ox/pif3 4-d-old etiolated seedlings. Each experiment was performed at least three times with similar results and the representative results were presented. Error bars represent average value ± sd (n = 3) from technical triplicates.

