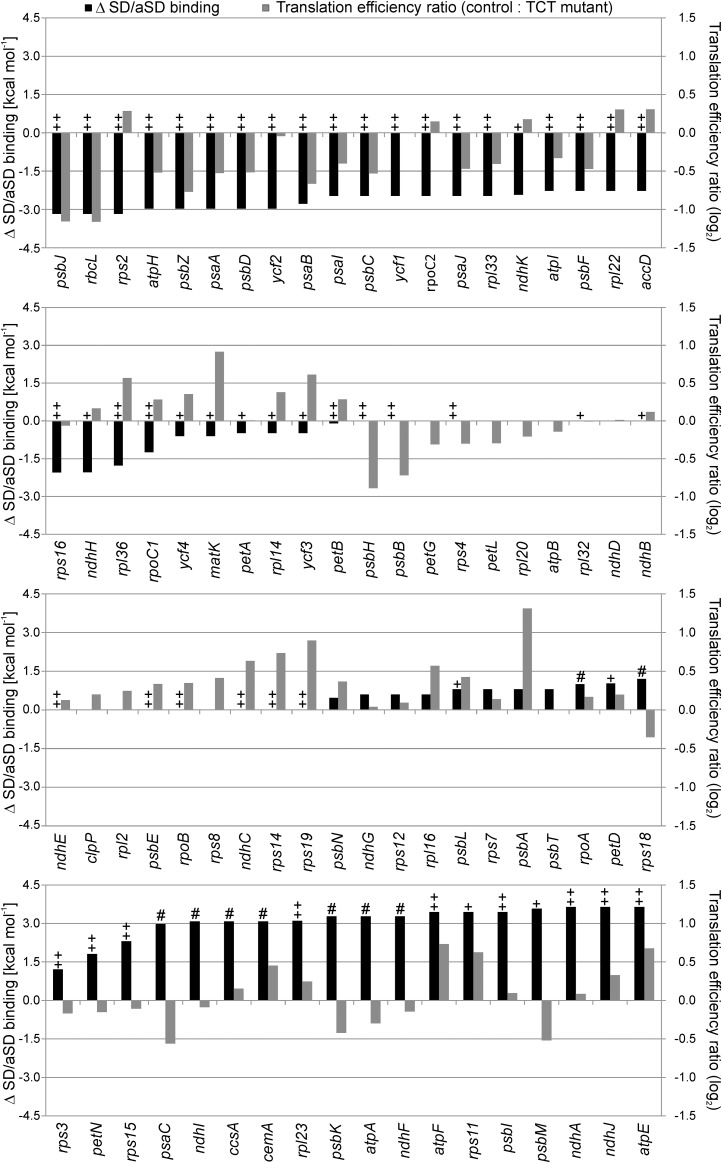
Figure 5.
Genome-Wide Comparison of the Calculated Changes in SD-aSD Binding and the Measured Changes in Translation Efficiency.
The changes in SD-aSD binding (black columns) were calculated for all plastid genes by subtracting the value for the TCT mutant (calculated by Free2Bind at 22°C; see Methods) from that calculated for the wild type. A negative value indicates a weakened binding in the TCT mutant, and a positive value a potentially strengthened SD-aSD interaction. The genes were sorted according to the difference in SD-aSD binding. The translation efficiency was calculated by normalizing the ribosome profiling data to the wild-type-like line E15 and dividing the signal intensities of the ribosome footprints by those of the transcripts for each probe. Displayed are median values for each coding region as ratio control/TCT (gray columns; log2 values). A negative value indicates reduced translation efficiency in the TCT mutant, a positive value increased translation efficiency. The ++ indicates genes with a strong putative SD (< −5 kcal mol−1) in the wild type, + genes with a relatively weak putative SD (−5 to 0 kcal mol−1), # genes that potentially gain a weak SD (−5 to 0 kcal mol−1) in the TCT mutant, and all unmarked genes lack any potential SD (>0 kcal mol−1). There were no genes that would gain a strong SD by the TCT mutation. Note that most genes with a strong SD that were predicted to display a reduction in the strength of the SD-aSD interaction in the TCT mutant showed a decline in translation efficiency (uppermost panel). By contrast, genes with unchanged or potentially improved SD-aSD binding displayed heterogeneous changes in translation efficiencies (lower three panels).

