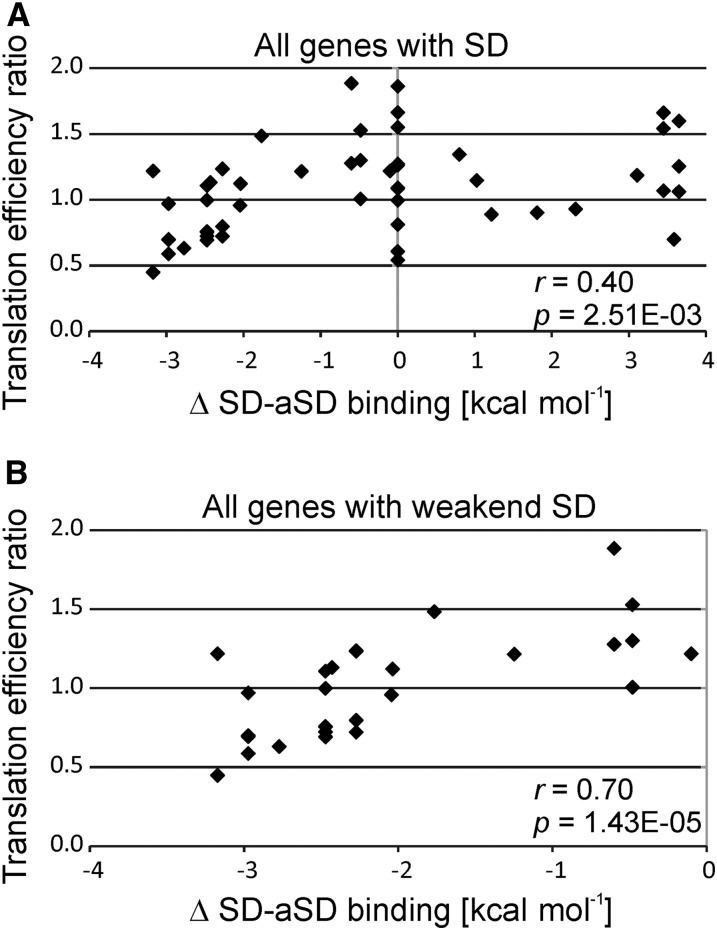
Figure 7.
Correlation between Measured Translation Efficiency and Calculated Impairment of SD-aSD Binding.
(A) Correlation analysis for all plastid genes with SD sequences. The relative change in the translation efficiency in the TCT mutant compared with the control line is correlated to the difference in the strength of SD-aSD binding. The values for the translation efficiency are the medians of the ribosome footprints normalized to the medians of the transcript levels for each coding region. The values for both the TCT mutant and the control line were normalized to the wild-type-like line E15, and the ratio control/TCT was used for this plot. The difference in SD-aSD binding was calculated by subtracting the value calculated for the TCT mutant (with Free2Bind; see Methods) from the value calculated for the wild-type aSD. A negative value indicates a weakened interaction and a positive value a stronger interaction in the TCT mutant. Pearson’s r and P value are given (in nEm non-superscript format for n⋅10m).
(B) Correlation analysis of plastid genes that are predicted to suffer from a weakened SD-aSD interaction in the TCT mutant.

