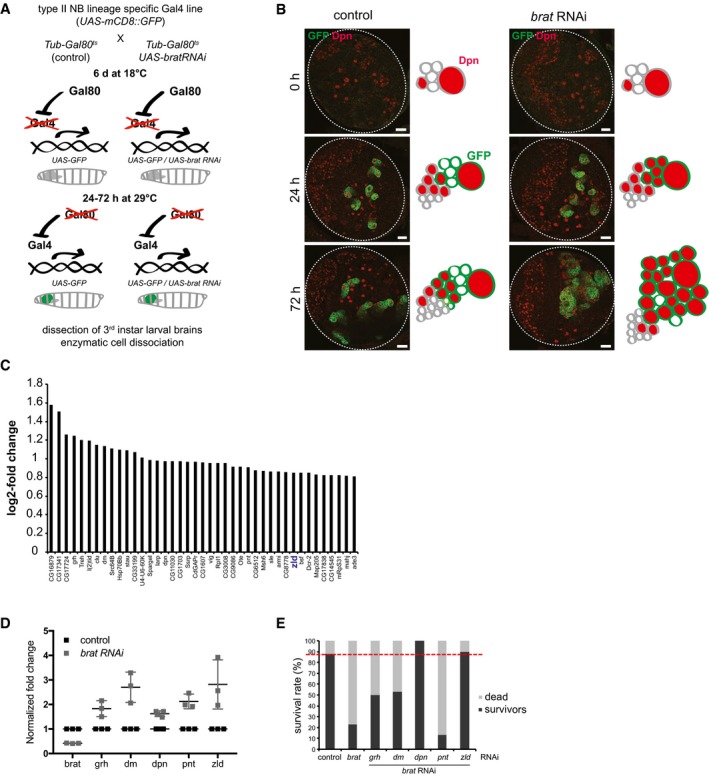
Figure 1. The transcriptional activator Zelda is a potential target of Brat.

- Cartoon illustrating the time‐ and tissue‐specific induction of brat RNAi.
- Images of brain lobes expressing brat RNAi and/or GFP in type II NB lineages (wor‐Gal4, ase‐Gal80) for 0, 24, or 72 h and stained for Dpn (red). Schematics represent the images.
- Plot showing log2 fold change in the expression of candidate target genes upon brat RNAi (one independent experiment).
- qPCR analysis of candidate target gene expression in FACS‐sorted control and brat RNAi type II lineages (induced with wor‐Gal4, ase‐Gal80) after 24 h of induction.
- brat rescue analysis of candidate target genes (one independent experiment). Survival rate of controls and double RNAi experiments (induced with wor‐Gal4, ase‐Gal80) was determined 2 weeks after adult hatching. Red dashed line indicates the survival rate of the control.
