-
A
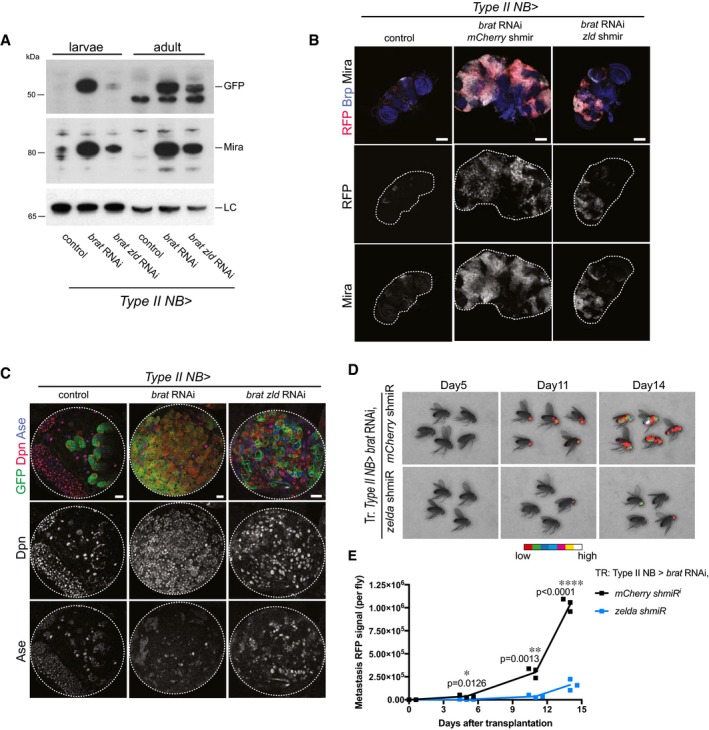
Western blot analysis of larval and adult brain tumors. brat tumors display high Mira and GFP levels, whereas upon brat zld double RNAi Mira and GFP levels are reduced in both larval and adult brains compared to control. LC, loading control lamin.
-
B
Images of adult brains of control, brat RNAi mCherry shmiR and brat RNAi zld shmiR (all isoforms) (induced with wor‐Gal4, ase‐Gal80). Type II NB lineages are marked with stinger‐RFP (red). Brains are stained for Bruchpilot (Brp, blue) and Mira (white). brat RNAi adult brains are overgrown by Mira‐positive NB‐like cells, whereas upon brat zld double knockdown tumors are reduced in size (images are representative of two (control) to three (other conditions) independent experiments).
-
C
Images of larval brain lobes of control, brat RNAi and brat zld double RNAi (induced with wor‐Gal4, ase‐Gal80). Type II NB lineages are marked with membrane‐bound GFP (green). Brains are stained for Dpn (red) and Ase (blue). brat RNAi tumors contain almost only GFP‐positive Dpn‐positive NB‐like cells, whereas upon brat zld double RNAi tumors contain GFP‐marked cells positive for Dpn or Ase, or Dpn and Ase.
-
D, E
Real‐time tumor metastasis burden after transplantation of brains expressing nuclear RFP, brat RNAi, mCherry shmiR (upper panels) and zld shmiR (lower panels) from type II NB driver wor‐Gal4, ase‐Gal80. ˜4,000 RFP‐positive cells were injected and RFP signal from whole fly was quantified 5, 11, and 14 days afterward. First metastasis only appeared 6 days later from brat zld RNAi brain injections (day 11 vs. day 5).
Data information: Pictures and blots are representative of three independent experiments if not otherwise indicated. Statistical analyses were done comparing
‐test. *
< 0.0001. Scale bars, 100 μm (B), 20 μm (C). See also
.

