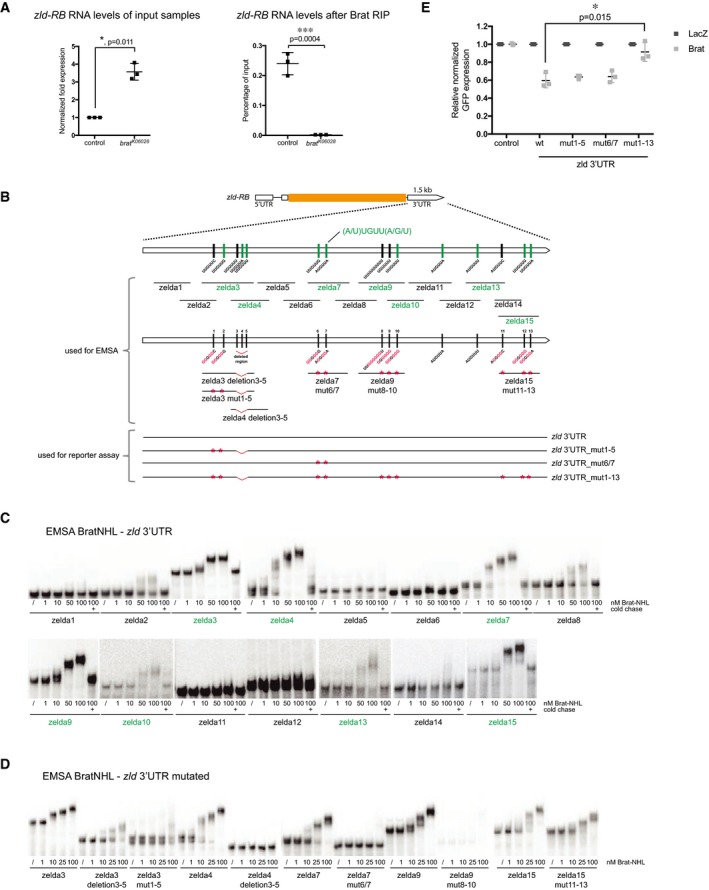
Figure 4. Brat directly targets the 3′UTR of zld via a specific binding motif.

-
AqPCR analysis of zld‐RB transcript after Brat‐RIP of control and brat K06028 mutant larval brain tissue. Left diagram represents zld‐RB RNA levels of the Input. Right diagram represents zld‐RB RNA levels after Brat‐RIP experiment.
-
BSchematic representation of zld‐RB locus and the zld‐RB 3′UTR fragments used in this study. Sites of the Brat‐binding motif within the zld‐RB 3′UTR are highlighted. Fragments which bind to Brat‐NHL are labeled in green; non‐binding fragments in black. Nucleotide mutations and deletions are marked in red.
-
C, DRecombinant Brat‐NHL was incubated with 32P‐labeled wild‐type (C) or mutated (D) zld RNA fragments as indicated and analyzed by native gel electrophoresis. Note that mutations of the Brat‐binding sites in the zld‐RB 3′UTR greatly impair RNA binding of Brat‐NHL.
-
EDrosophila S2 cells were cotransfected with GFP‐zld‐RB 3′UTR reporters as indicated together with full‐length Brat. RFP was used as a transfection control; LacZ was used as an overexpression control. Note that repression of GFP‐zld‐RB 3′UTR reporter bearing all Brat‐binding site mutations is greatly reduced.
