-
A
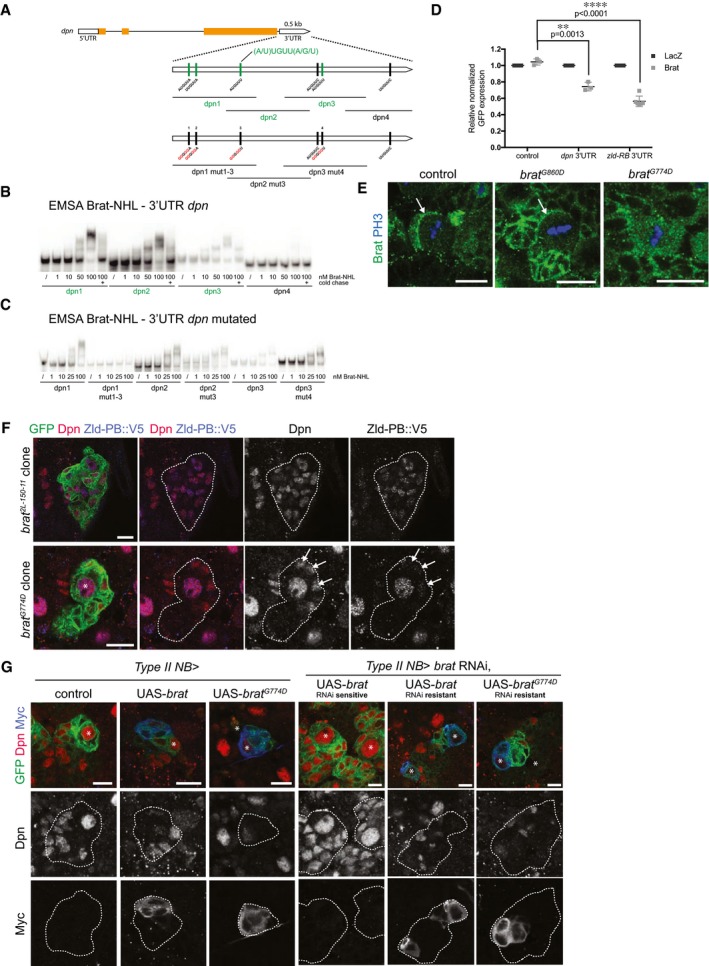
Schematic representation of dpn locus and the dpn 3′UTR fragments used in this study. Sites of the Brat‐binding motif within the dpn 3′UTR are highlighted. Fragments which bind to Brat‐NHL are labeled in green; non‐binding fragments in black. Nucleotide mutations and deletions are marked in red.
-
B, C
Recombinant Brat‐NHL was incubated with 32P‐labeled wild‐type (B) or mutated (C) dpn RNA fragments as indicated and analyzed by native gel electrophoresis. Note that mutations of the Brat‐binding sites in the dpn 3′UTR greatly impair RNA binding of Brat‐NHL.
-
D
Drosophila S2 cells were cotransfected with GFP‐dpn 3′UTR or GFP‐zld‐RB 3′UTR reporters as indicated together with full‐length Brat. RFP was used as a transfection control; LacZ was used as an overexpression control.
-
E
Close‐up images of larval brain NBs stained for PH3 (blue) and Brat (green). In control and brat
G860D mutant NBs Brat localizes asymmetrically during mitosis (arrows), whereas in brat
G774D mutants Brat remains ubiquitously distributed.
-
F
Close‐up images of brat
2L‐150‐11 or brat
G774D mutant type II NB lineages marked by membrane‐bound GFP expressing endogenous Zld‐PB::V5 and stained for Dpn (red) and V5 (blue). White arrows indicate immature INPs failing to repress Dpn but not Zld‐PB in a brat
G774D clone.
-
G
Close‐up images of type II NBs marked with membrane‐bound GFP expressing with wor‐Gal4, ase‐Gal80, (left panels) Myc‐tagged wild‐type brat, or brat
G774D or (right panels) RNAi‐sensitive or RNAi‐resistant Myc‐tagged Brat constructs together with brat RNAi and stained for Dpn (red) and Myc (blue). Asterisks designate type II NB.
Data information: Pictures and blots are representative of three independent experiments. Error bars represent standard deviation. Statistical analyses were done using
‐test. **
< 0.0001. Scale bars, 10 μm. See also
.

