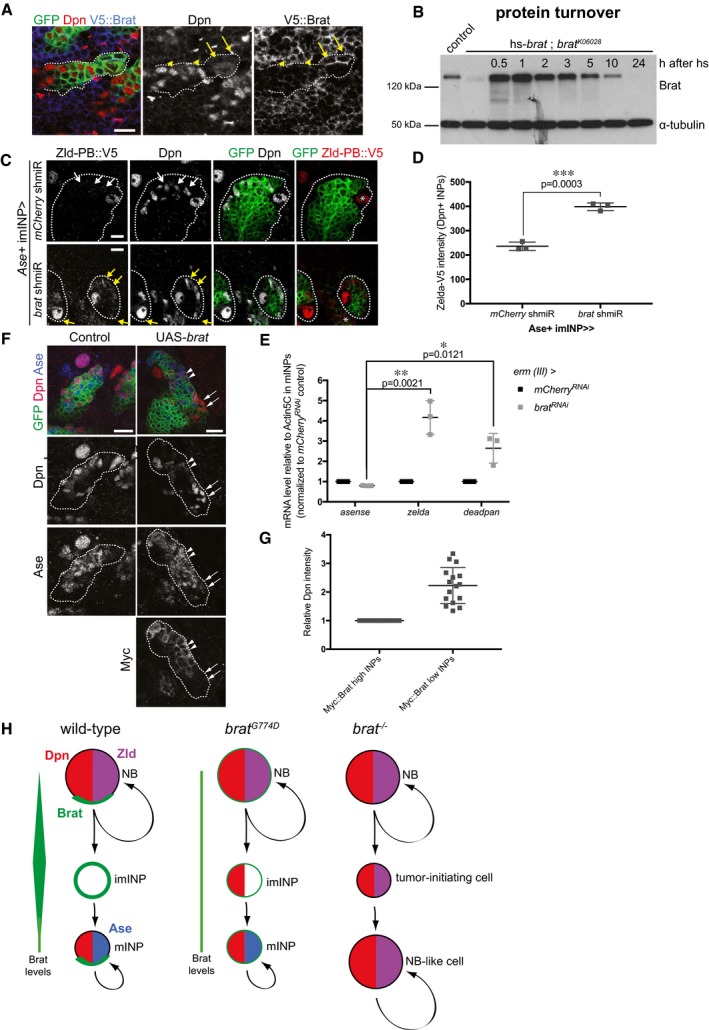
Close‐up images of larval brains expressing brat shmiR and membrane‐bound GFP from type II NB driver (wor‐Gal4, ase‐Gal80) and stained for Dpn (red) and V5‐Brat (blue). Yellow arrows and arrowheads indicate Dpn‐negatve immature INPs and Dpn‐positive mature INPs, respectively.
Western blot analysis showing Brat protein turnover. Flies expressing Brat under control of the heat‐shock promoter (hs‐brat) were heat‐shocked for 1 h and Brat expression was determined at indicated time points after heat shock. Note that around 1 h Brat expression reaches its maximum and after 5–10 h, the expression level is strongly reduced.
Close‐up images of type II NB lineages expressing endogenous V5‐tagged Zld‐PB and expressing membrane‐bound GFP, mCherry, or brat shmiR from Ase+ INPs driver (erm‐Gal4, 3rd chromosome) stained for Dpn and V5 (red). Note brat shmiR INPs re‐express Zld‐PB::V5 (yellow arrows) compared to mCherry shmiR INPs (white arrows).
Quantification of Zld‐PB::V5 signal (intensity normalized by the INPs’ outlined surface, ImageJ) from mCherry and brat shmiR Dpn‐positive INPs per lineage.
qPCR analysis of Ase (negative control), zld and dpn transcripts after brat RNAi in FACS‐sorted Ase+ INPs (erm‐Gal4, 3rd chromosome).
Close‐up images of type II NB lineages expressing membrane‐bound GFP and myc‐tagged Brat from the Ase‐positive imINP driver (erm‐Gal4 on the 3rd chromosome) and stained for Dpn (red) and Myc. mINPs expressing high (arrowheads) and low (arrows) Myc‐Brat are indicated.
Quantification analysis of Dpn fluorescence intensity measurements in mature INPs expressing high levels of Myc‐Brat (closer to the NB) vs. in INPs expressing low levels of Myc‐Brat (more distant to the NB). White asterisks indicate type II NB.
Model of Brat‐mediated repression of Zld and Dpn in type II NB lineages.
Data information: Pictures and blots are representative of three independent experiments. Error bars represent standard deviation. Statistical analyses were done using
‐test. *
< 0.001. Scale bars, 10 μm. See also
.

