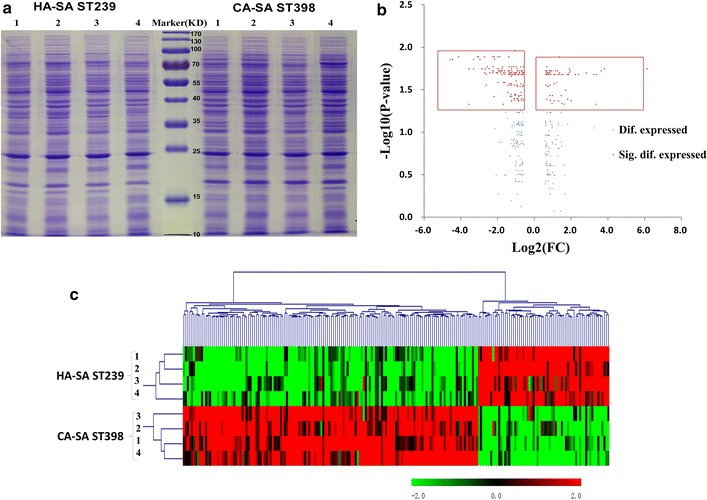
Fig. 2.

a Comparison of the total proteins between the CA-SA ST398 and HA-SA ST239 isolates by SDS-PAGE. b Volcano plot of differentially expressed proteins in the HA-SA ST239 versus CA-SA ST398 isolates. c Hierarchical cluster analysis was conducted for all the differentially expressed proteins in the HA-SA ST239 group versus the CA-SA ST398 group
